Looking beyond the booking at the state of hospitality in 2023
As the shackles and impact of the COVID-19 pandemic appear to finally be loosening, it has been refreshing to see UK restaurant doors open once more and the sector getting back into full-swing.
Despite this, rising energy prices, inflation, and a volatile economy have led to a longer route to post-pandemic recovery than first envisaged. The result is a remaining sense of unwelcome uncertainty for hospitality businesses and their customers.
It is encouraging to see a third of restaurants well on their way to recovery, forecasting more revenue this year compared to last. But by equal measure, a third of businesses are also forecasting less revenue this year, averaging a 17% reduction on 2022. This demonstrates a split sector when it comes to expectancy for overall success and growth. Whether you expect your business to grow this year or not, attracting bookings, generating as much revenue as possible and creating more efficient operations will be key to your success.
Alongside our survey findings from the hospitality industry, this report will also provide insight and guidance from our expert team to help businesses navigate and plan for the year ahead.
Jump to section:
- Forecasts: Restaurant Revenue
- Dining Frequency
- Dining Budgets
- Deposits and no-shows
- Operations: Operating Hours
- Operations: Staff & Suppliers
- Dining Habits: Lead Times
- Dining Habits: Influence
- Dining Habits: Preferences
Download the full report now
Forecasts: Restaurant Revenue
When assessing restaurants’ revenue forecasts for 2023, we’re presented with a mixed outlook for the year ahead. While it is positive to see over a third (34%) forecasting growth compared to 2022, the same proportion (34%) also forecast less revenue, with 32% expecting no change.
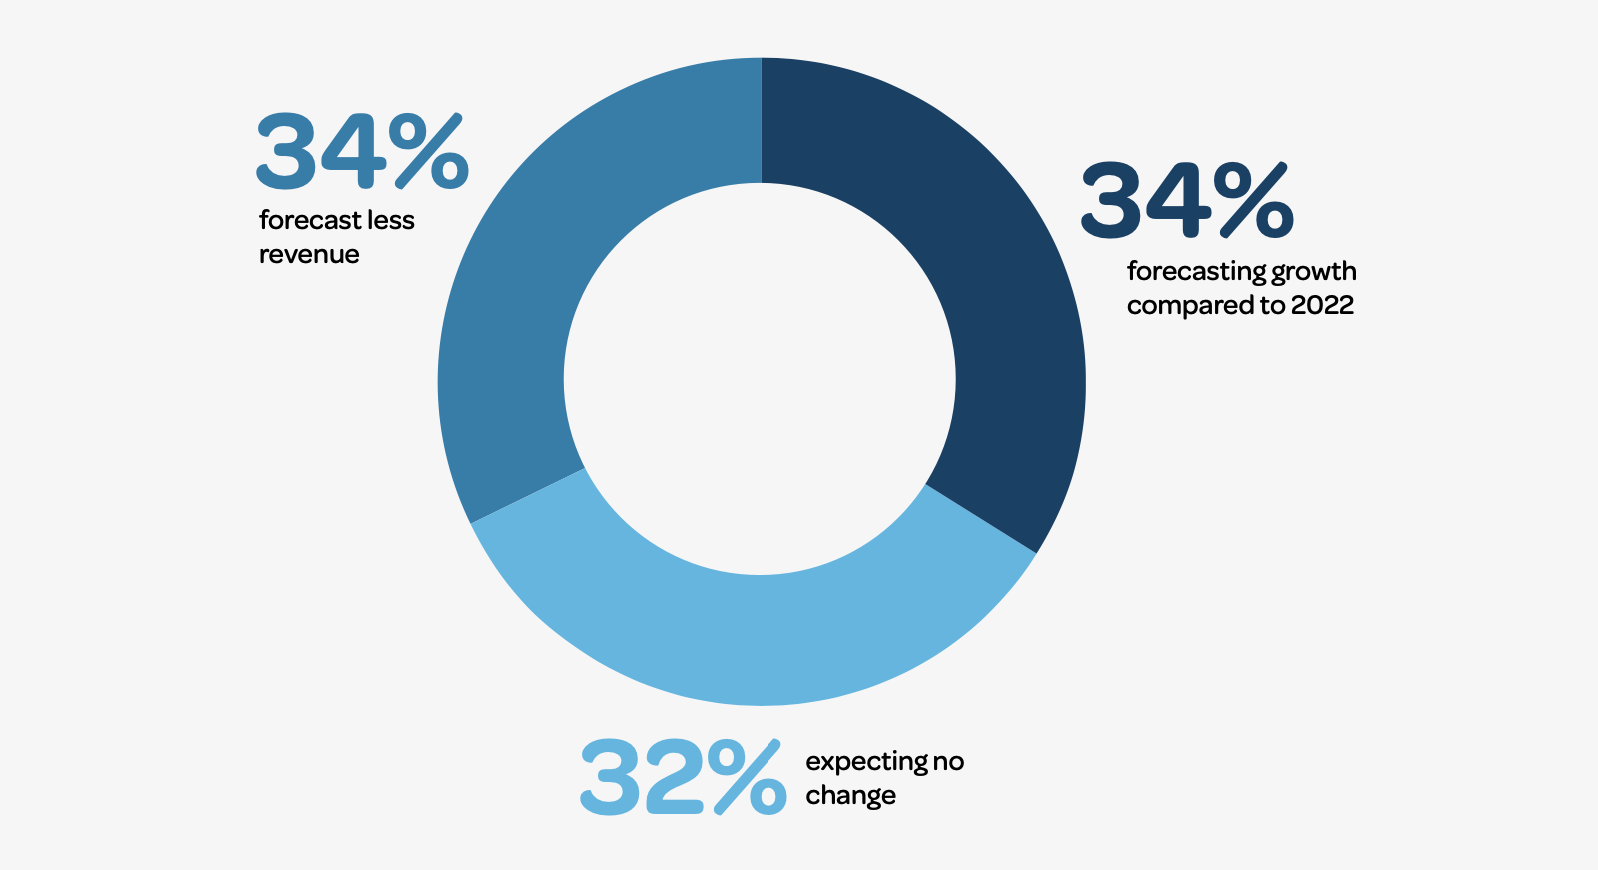
The restaurants forecasting growth are expecting to grow by 13% on average. However, the overall growth forecast of all respondents is -2%, as those forecasting less revenue are averaging a decline of 17%.
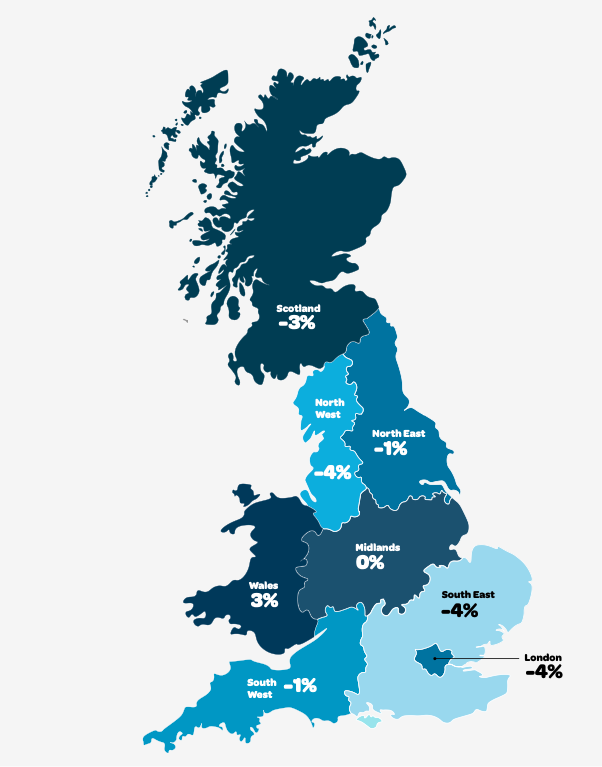
There is some variation in regional forecasts and there are several variables that need to be considered when rationalising these different outlooks. This includes changes to dining habits, budgets and impacted restaurant operations by wider economic factors, which will all be explored throughout this report.
How does your forecasted revenue for 2023 compare to the revenue your restaurant generated in 2022? (Average by region):
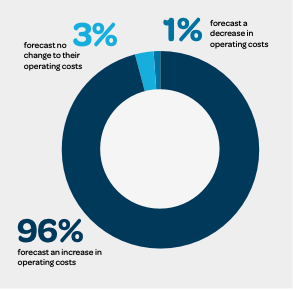
The sharp and sudden rise in energy costs and its impact on restaurant operations has been well documented. It therefore comes as no surprise to see almost all restaurants (96%) forecasting increased costs for 2023 compared to 2022.
How much are costs rising? According to our data, the average restaurant is experiencing a staggering 22% increase. When you combine this with the average reduction in forecasted revenue, all signs point to highly impacted profits in 2023 for hospitality.
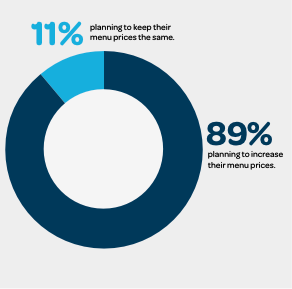
Almost nine in ten (89%) restaurants are planning to increase their menu prices to help compensate for rising costs. Price changes are expected to range between increases of 5 and 25%. The average menu price is expected to increase by 11% to mitigate the impact of higher operating costs.
How do your forecasted operating costs for 2023 compare to 2022?
Are you planning to increase prices for certain menu items to combat rising costs?
Dining Frequency
Increased costs haven’t just impacted businesses. With less disposable income and tighter budgets, dining habits are also changing for consumers.
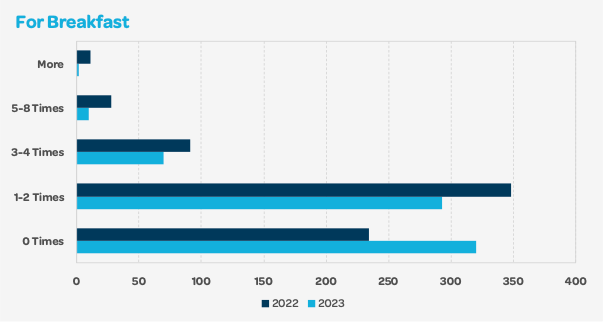
In 2022, almost half of diners (49%) dined out for breakfast between one and two times per month. Today, 46% said they would now avoid eating out for breakfast.
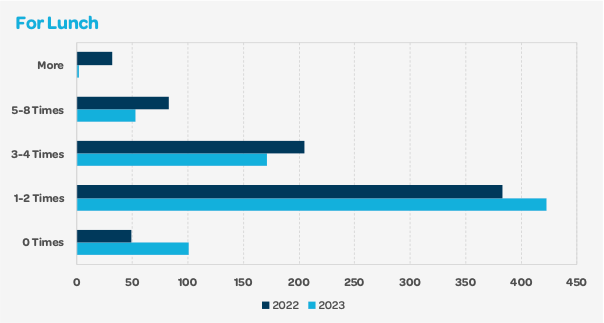
Thankfully, the frequency of lunchtime dining remains consistent, with more than half of diners eating out for lunch one to two times per month in 2022 and 2023, respectively.
However, those who dined out for lunch more often in 2022 are now doing so less frequently, while the proportion of consumers not dining out for lunch at all has almost doubled from 7% in 2022 to 13% in 2023.
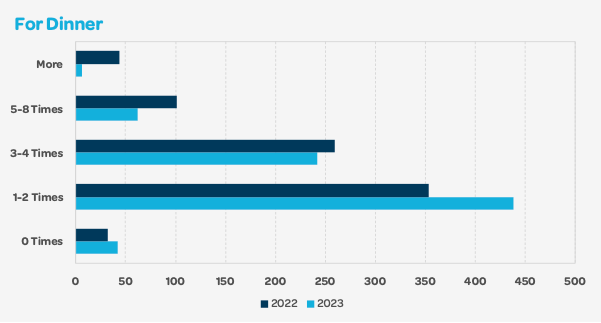
Similarly, most diners (55%) currently dine out in the evening either once or twice per month. This was also similar for most diners (45%) in 2022. Again, those who ate out more frequently now appear to be reducing the number of times they eat out each month.
How often are you currently dining out each month?
Dining Budgets
As a nation of food lovers, there remains a strong desire from UK consumers to continue enjoying great restaurants and bars. Despite this, we’re seeing more moderation from diners who are reducing the number of times they eat out each month. This is also the case when it comes to dining budgets.
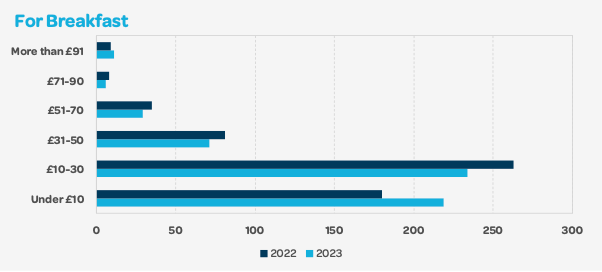
Most diners (41%) currently plan to spend between £10 and £30 on breakfast each month, with the proportion of those spending more than this reducing between 2022 and 2023. Similarly, the number of people budgeting under £10 for breakfast has increased from 31% in 2022 to 38% in 2023.
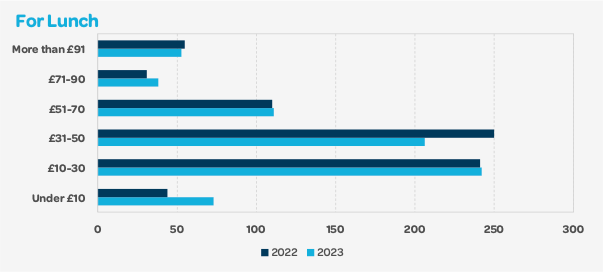
The same trend can be seen in lunchtime dining, for which most of us spend £10- 30 per month. One in ten are now budgeting less than £10 for lunch per month, compared to 6% in 2022.
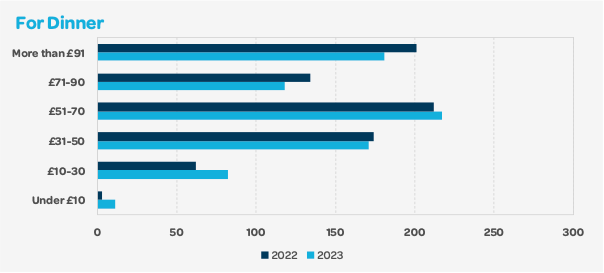
Most people spend more on eating out in the evening, with almost a third of diners (30%) planning to spend between £51 and £70, while a quarter (25%) budget more than £91 each month.
The good news for 2023 is that budgets for evening dining appear to have been less impacted by the current economic backdrop. Previous research based on feedback from a Dish Cult survey also found that 74% of respondents want to be rewarded for dining out regularly, highlighting the increasing need to incorporate loyalty programmes to reward diners and encourage repeat business.
When dining out, how much did/do you spend on average each month in 2022/23?
Deposits and No-shows
Attracting and securing bookings is essential to the success of any restaurant. However, the ability to maintain these bookings has become increasingly important and more strategic in recent years thanks to the costly pain of no-show diners.
Between the start of the year and February 2023, 5% of confirmed bookings resulted in no-shows, costing £1,325 to the average restaurant during this period alone – it’s worth considering what that cost could be for your restaurant for the entire year.
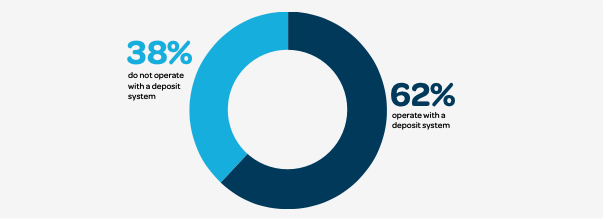
It is therefore unsurprising to see restaurants taking action in preventing no-shows. The majority (62%) of restaurants today utilise booking systems like ResDiary to implement deposit schemes, so payments can be made by prospective diners or their card details can be saved when they book online, over the phone, or in person.
Our study has shown that the average required deposits range between £5 and £45 per person, with an overall average of £11.50 per person. Restaurants implementing a deposit scheme most commonly request £10 per person.
Of those running deposit schemes, most venues (78%) only require a deposit for bookings of a certain size – a minimum of eight covers on average.
While a rise in required deposits for bookings is not unexpected in the near future, we also expect restaurants to take advantage of customer reminders, such as via email or SMS, to remind customers of their booking to to help reduce no-shows.
Does your restaurant require a deposit for bookings?
Operations: Operating Hours
It’s no secret that hospitality venues have had to adapt their operations in the face of different challenges.
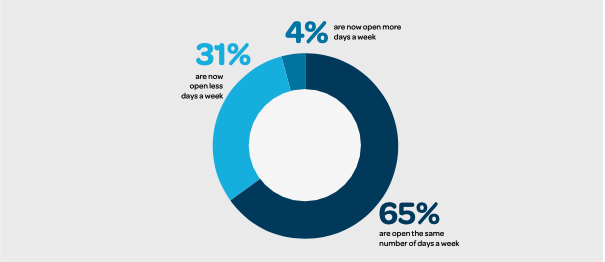
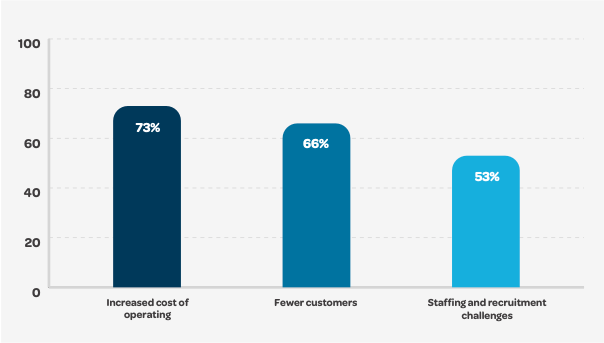
In the last six months, almost a third of restaurants (31%) are now open on fewer days each week to cut down on costs, while 65% remain unchanged.
On average, those venues operating fewer days are now closed for an additional one and two days per week compared to six months ago. Unsurprisingly, the leading reason for this decision is based on the increased cost of operations, which is highlighted by almost three quarters (73%) of those with reduced opening days.
As well as this, two thirds (66%) associate this decision with having fewer customers, followed by more than half (52%) highlighting staffing and recruitment challenges.
Reduced services also continue when it comes to operating hours, as nearly a third of venues (31%) are similarly closing their doors for longer to combat fewer customers, staff, and increased costs. On average, those operating reduced hours are open for 4.5 hours less per week, compared to six months ago.
While cost-cutting and staff shortages may be thrust upon your business, it is important to bear in mind that closing your doors may also be closing opportunities for vital revenue generation when it’s most needed.
If you do intend on closing for more days, then it may be a good idea to make your venue available for events and large parties when the space is going to be empty. By making it possible to take enquiries of this nature, you could remain open to good opportunities to generate revenue.
In the last 6 months, which of the following best describes the number of days you are open?
Which of the following reasons are you open for less days than before?
Operations: Staff & Suppliers
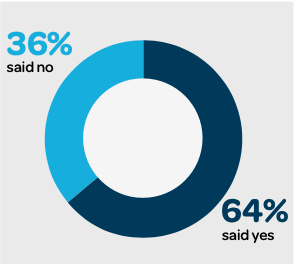
With the role of recruitment and retention demonstrating its influence, almost two thirds (64%) of restaurants are currently looking to fill staff vacancies.
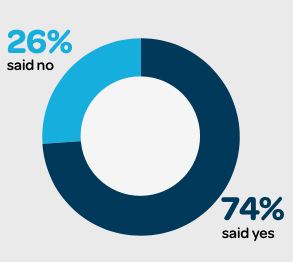
This is in line with research ResDiary conducted back in 2022, which found that staffing issues were the biggest business challenge restaurants face. The impact of the sector’s staff shortage has also been highlighted by almost three quarters of restaurants (74%) experiencing challenges with their supply chain in the last six months.
A reduction in customer service quality, response time, and delivery options are among the key challenges restaurants are highlighting with their suppliers.
In addition, increased prices, lack of stock, and reductions in quality are further concerns. As a result, more than half of restaurants (53%) have had to reduce the size of their menu between the end of 2022 and the start of 2023.
Does your restaurant currently have any staff vacancies?
Have you experienced any challenges with your supply chain in the last 6 months?
Dining Habits: Lead Times
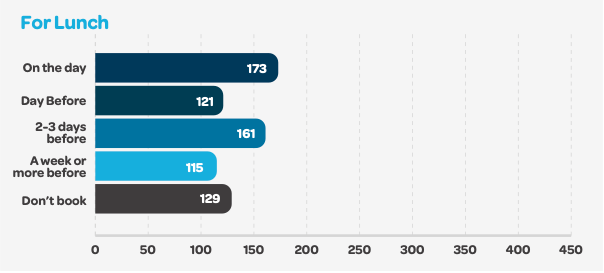
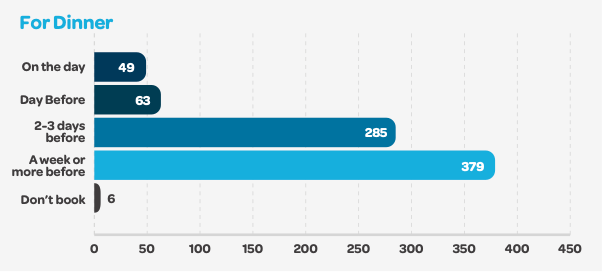
When it comes to making a reservation, diners’ habits continue to differ between breakfast, lunch, and dinner, as evident by their varying budgets and frequencies for each.
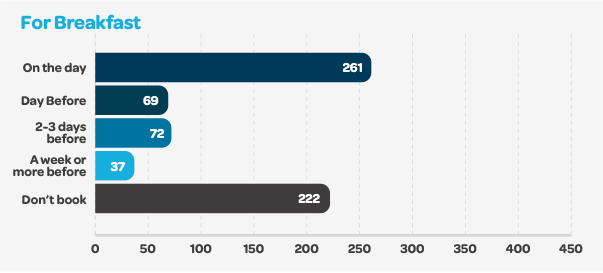
For breakfast, over a third of diners (34%) will try their luck and hope for a walk-in. That’s significantly lower (18%) when it comes to dining out for lunch. By contrast, just 1% of diners won’t book in advance when it comes to an evening meal.
For evening dining, almost half (48%) of diners make a reservation at least a week or more in advance, reflecting more in-demand dining times and competitive availability. Preceding this, over a third (36%) will book a dinner reservation two to three days in advance, while a quarter (15%) will attempt on-the-spot walk-ins.
By contrast, a much higher number of people will try to book for breakfast on the day (39%). This is the most common approach for morning and lunchtime bookings, with a quarter (25%) taking the same approach for lunch.
How far in advance do you book a restaurant?
Dining Habits: Influence
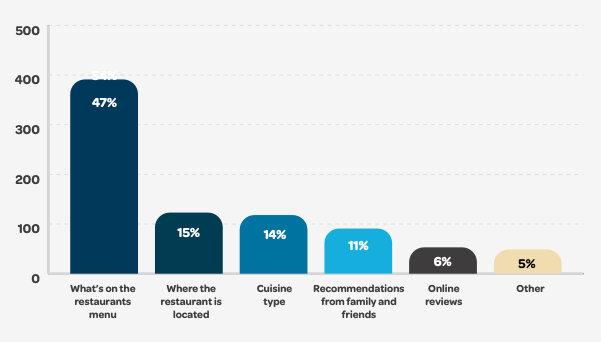
When deciding where to eat out, almost half of consumers (47%) consider what’s on the restaurant’s menu to be the most important factor.
This is followed by where the restaurant is located (15%), cuisine type (14%) and recommendations from friends and family (11%). By contrast, recommendations by social media influencers are deemed most important to just 1% of diners.
Reinforcing the value of friend and family referrals, restaurants will want to ensure that they always provide a memorable and positive experience to encourage return visits and word-of-mouth promotion.
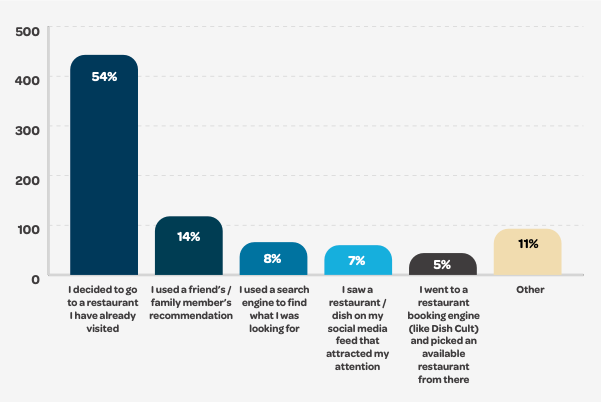
For more than half of diners (53%), when looking back to the last time they decided to dine out, they decided to go to a restaurant they have already visited before. As well as this, 14% of diners used a friend or family recommendation when deciding where to eat the last time they dined out.
What do you consider most important when making your decision on where to eat out?
Thinking back to the last time you decided to dine out, how did you decide where to go?
Dining Habits: Preferences
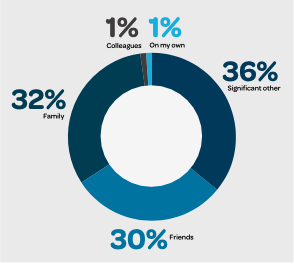
Dining out with family is a common way to celebrate a special occasion, so it comes as little surprise to see almost a third (32%) of diners eating out with their family most often.
Similarly, 30% dine out with their friends most often, while a significant other is the most common restaurant companion for 36% of diners. By contrast, eating out with colleagues and eating alone is most common for just 1%, respectively.
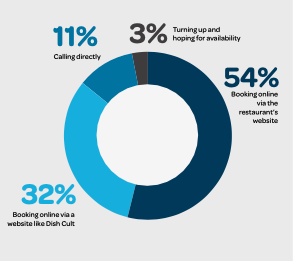
When it comes to making a reservation, the evolution of restaurant technology has been embraced by most. Today, over eight in ten (86%) diners highlight their preference to book online, with just 11% preferring to call directly.
Demonstrating the importance of a restaurant’s digital profile, more than half (54%) of diners will go directly to the restaurant website to make a booking, while almost a third (32%) utilise restaurant discovery platforms like DesignMyNight to reserve a table.
Who do you dine out with most often?
Which of the below is your preferred restaurant booking method?
Navigating the challenges ahead
Businesses are being challenged on multiple fronts and there of course internal pressures and goals to overcome. We hope you’ve found in our research the information you need to help steer your strategy and maintain healthy revenue for the short to long term future.
Technology has an important role to play in supporting businesses through tough times and growth too. Integrations that can improve the experience your diners enjoy, before and after their booking, could be key to maximising your revenue.
Rest assured, ResDiary will continue to support our users in making the most of every opportunity to attract and delight more diners.
Download the full report!
We hope this research has given some useful insight and guidance to help your business navigate the year ahead. Our expert team is always on hand should you have any further questions about your needs or you are seeking guidance. You can also save your copy of the full report right here.




.png)