
Australia
•
19 Apr, 2024

View ResDiary's 2024 Hospitality Statistics here. and 2023 Hospitality Statistics here
2022 heralded the tentative return to normalcy for the hospitality industry in Australia. Travel restrictions have eased, tourists are starting to come back into the country, and most hospitality services are back up and running to full capacity.
To fully understand this changing landscape within the hospitality industry, we have analysed 2022's industry data and provided an in-depth report on our findings. These statistics can provide the basis for calculating future trends and performances, as well as where higher areas of revenue can be found.
Before we look into the hospitality industry Australia statistics for 2022, we have to understand how the industry got to that point by looking back at 2021.
The pandemic was still going strong that year, with Australia's second lockdown causing a large portion of the hospitality industry to grind to a halt from June to October. Employment levels were still trying to recover from 2020, with the Australian Bureau of Statistics calculating that levels in Accommodation and Food Services came to 849,500; a significant drop from the peak of 923,300 in 2019, but a marketable improvement from 826,600 in 2020.
Despite employment levels not quite reaching the normality of 2019, several areas of sales still showed signs of increased improvement in 2021. In fact, sales from integrated orders in early 2021 were nearly as high as peak lockdown during May 2020; showing that Australia has since adapted to the new standards of sales.
Australians also proved to be more than ready to take advantage of any time out of lockdown, with food services showing a marketable improvement in their annual revenue from 2020. Across cafes, restaurants and takeaway food services, Statista quantified an annual revenue of $45.78 billion in 2021. This is a noticeable rise from $39.75 billion in 2020, the lowest amount of annual revenue since 2014. If the food industry continues in its trend of steadily increasing in revenue as it did before the impact of the pandemic, then it is expected that the future of the industry's success is expected to continue to increase.
Finally, the trend in services of hotels and resorts within 2021 showed a similar increase to the food industry when compared to 2020. The lockdown laws Australia went through meant there were few chances to spend overnight outside of the home, with the market size dropping from $1597.7 million in 2019, to its lowest point of $1040.8 million in 2021, according to IBISWorld.
When it comes to consumer spending trends within the hospitality industry during 2022, it is clear that 2021's influx of revenue is continuing into the new year. With no further lockdowns, Australians were free to access any services at any time, including those that may have been closed down during the pandemic.
This means more money being spent by consumers, particularly within the hospitality industry, as the annual revenue of cafes, restaurants and takeaway food services amounted to over $58 billion in 2022. According to Frollo, monthly spending on pubs, cafes, restaurants and takeaway is up by 22% since 2021, coming to $2,048, a significant rise from the previous year's $1,675.
To get a further understanding of the industry data of Australia's hospitality services, a close-up of demographic trends is necessary. Between age, gender and income level, we can get a clearer picture of how these demographics contribute to and affect industry data.
When it comes to spending growth within the hospitality industry according to age, it is easiest to go by generational age brackets. This way, you get a clear division between age groups and their spending habits.
Frollo's report on Australian spending in 2022 reveals that Gen Z, those within the 10-25 age bracket, are actually spending the most on food services; a 27% increase in spending from 2021. Despite being the youngest generation, this age group seems the most willing to go out and spend big out at restaurants and cafes alike each month.
In contrast, Baby Boomers (58-78 years of age) saw the smallest increase of only 2%. This data implies that there will be a continuous increase in spending habits as each new generation enters the market.
When it comes to hospitality services, food is a major focus of many studies, including ResDiary's poll on Australian interests in cuisine. Japanese remains the top trending cuisine in Australia, with ramen and sushi listed as the most popular takeaway options during a lockdown period. However, these exact focuses of desired cuisines are subject to change between genders.
Although Australia already has a range of cultural cuisines readily available across the country, there are still other businesses that citizens are specifically interested in. For men, this is burgers, Chinese, pizza and Indian. While women follow overall popular trends like Japanese, Mexican and Italian.
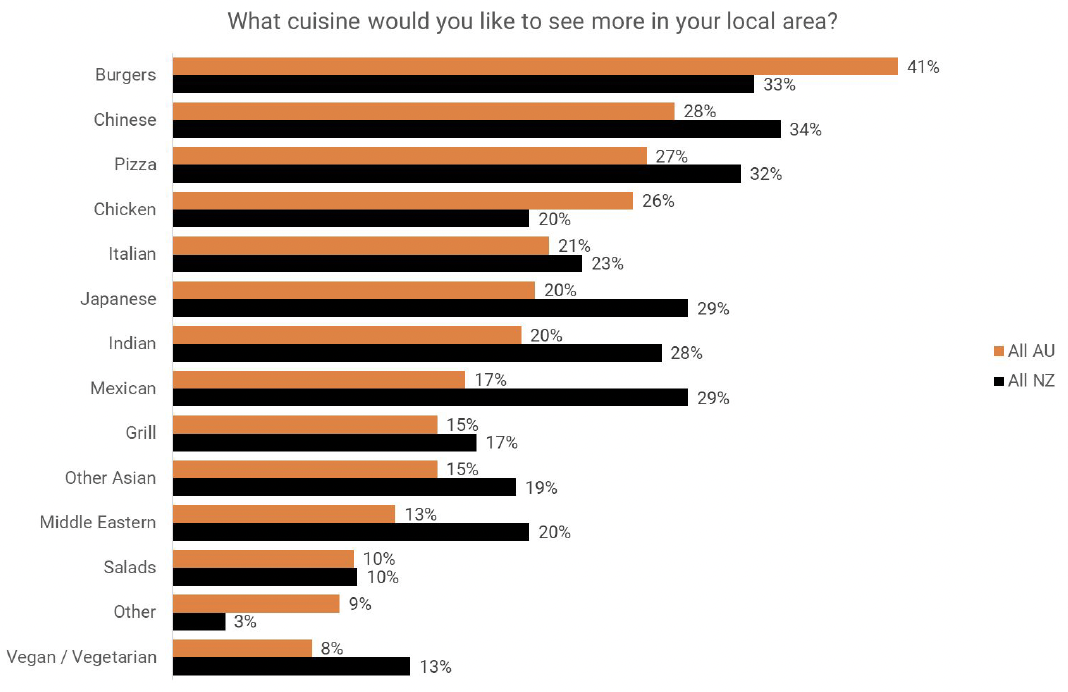
These interests in cuisine may shape the future of food-related industries, especially if demand for these food types continues to rise.
With the pandemic causing a rise in home cooking, thus causing a drop in eating out habits in Australians, 2022 seems to be the year of recovery. This applies to all Australians, regardless of their income level. However, the businesses customers have chosen to visit are still affected by their financial situation, especially as the cost of groceries is continuing to rise, making it more difficult to afford home cooked meals.
The demand for convenience has grown, with takeaway orders, delivery and even food subscription services seeing a surge in request. This is likely due to the continued desire for no-contact services, and possible nerves around exposing oneself to covid-19 when seated in an establishment. With the increasing cost of groceries, this trend suits those of a lower income bracket, especially when it comes to ready-made meals.
This convenience includes fast food eating habits, with younger and less financially stable people buying a significant amount more than other age or income groups. While an average Australian spends 32% of their weekly food budget on fast food, it is clear that those in lower income levels will spend a lot more eating out.
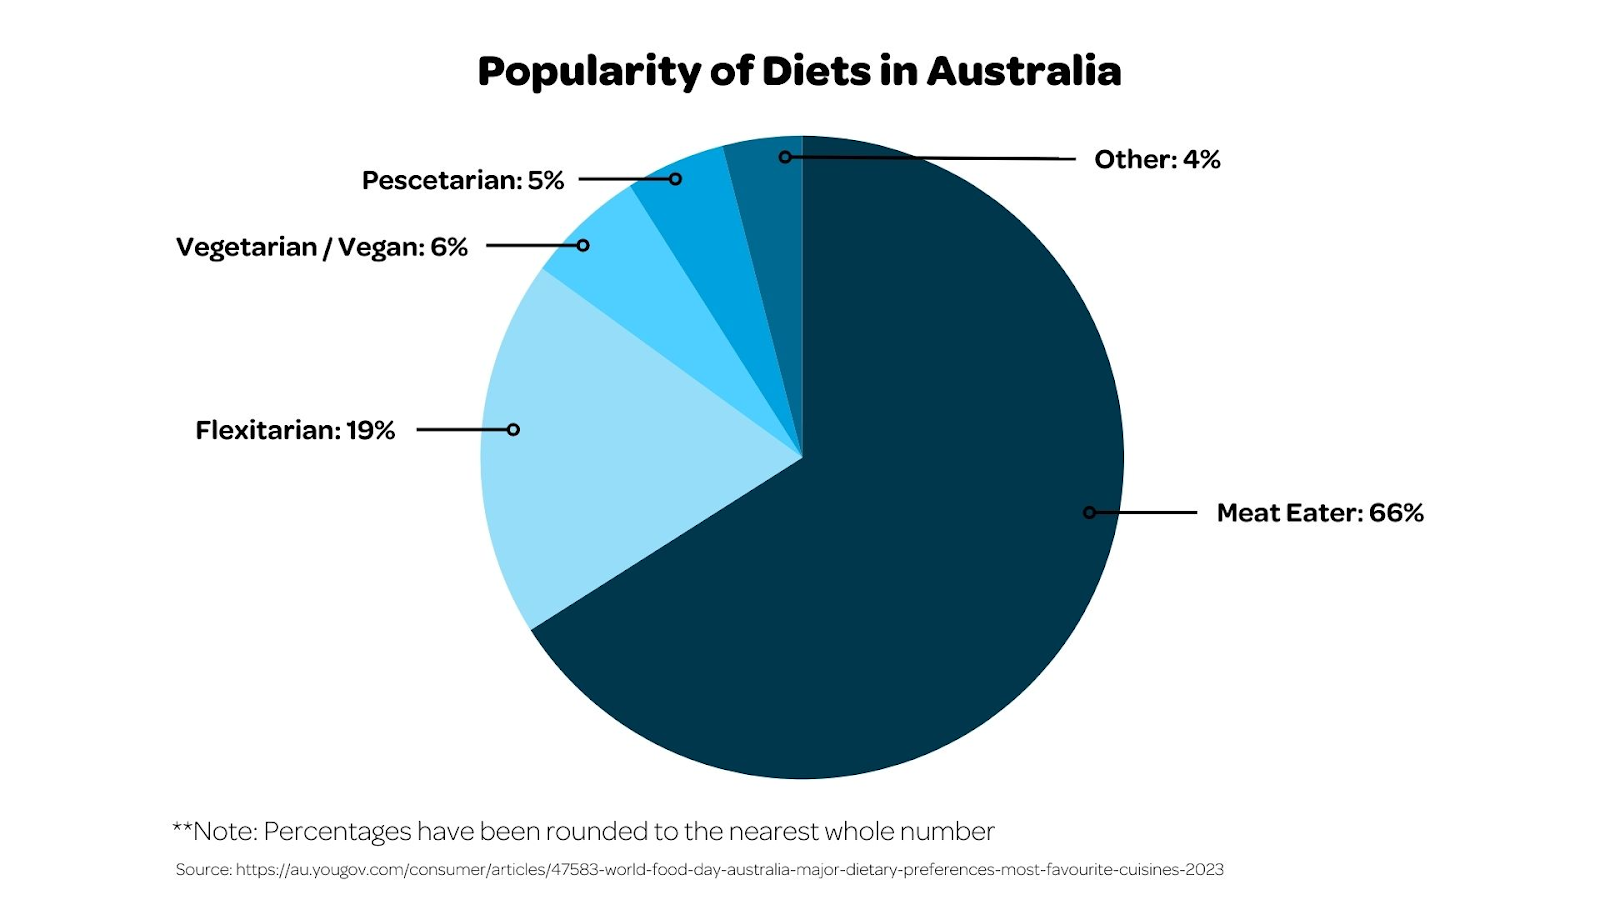
In return, sustainable and ethical plant-based diets are becoming more popular across Australia, with around 2.5 million of the populace being vegan or vegetarian now. A plant-based diet costs an average of $750 less a year on food than meat-eaters, making trends like this accessible to anyone, regardless of income level.
Eating out has become increasingly popular with lockdown restrictions eased, and this popularity means that requesting a booking at your favourite business has become vital. Without a booking, there is a high chance you will miss out on your dinner date or lunch catch-up.
For overall booking numbers, approximately 30.1% of them were done online through businesses' websites or apps. This trend is expected to increase as more restaurants and cafes introduce flexible and easily managed booking services. Particularly smaller businesses, who accounted for 46% of bookings in the market during 2022.
These kinds of trends would not be possible without the usage of interactive and adaptive booking technology. Through the ability to accept online bookings, any business can look forward to continued success come 2023.
With the previous dip in employment numbers from 2020-21, technology has been required to fill in several of the gaps within the hospitality business. Convenience, efficiency and speed have become highly valued, with businesses reflecting these needs through the rise of online bookings, as well as other services like:
Cloud-based communications, including point of sale systems and card readers.
Providing wireless for portability and flexibility.
Automating certain procedures, as well as providing self-service.
Contactless payments.
Chatbots on apps or websites to replace calls or emails about simple questions.
Mobile check-ins.
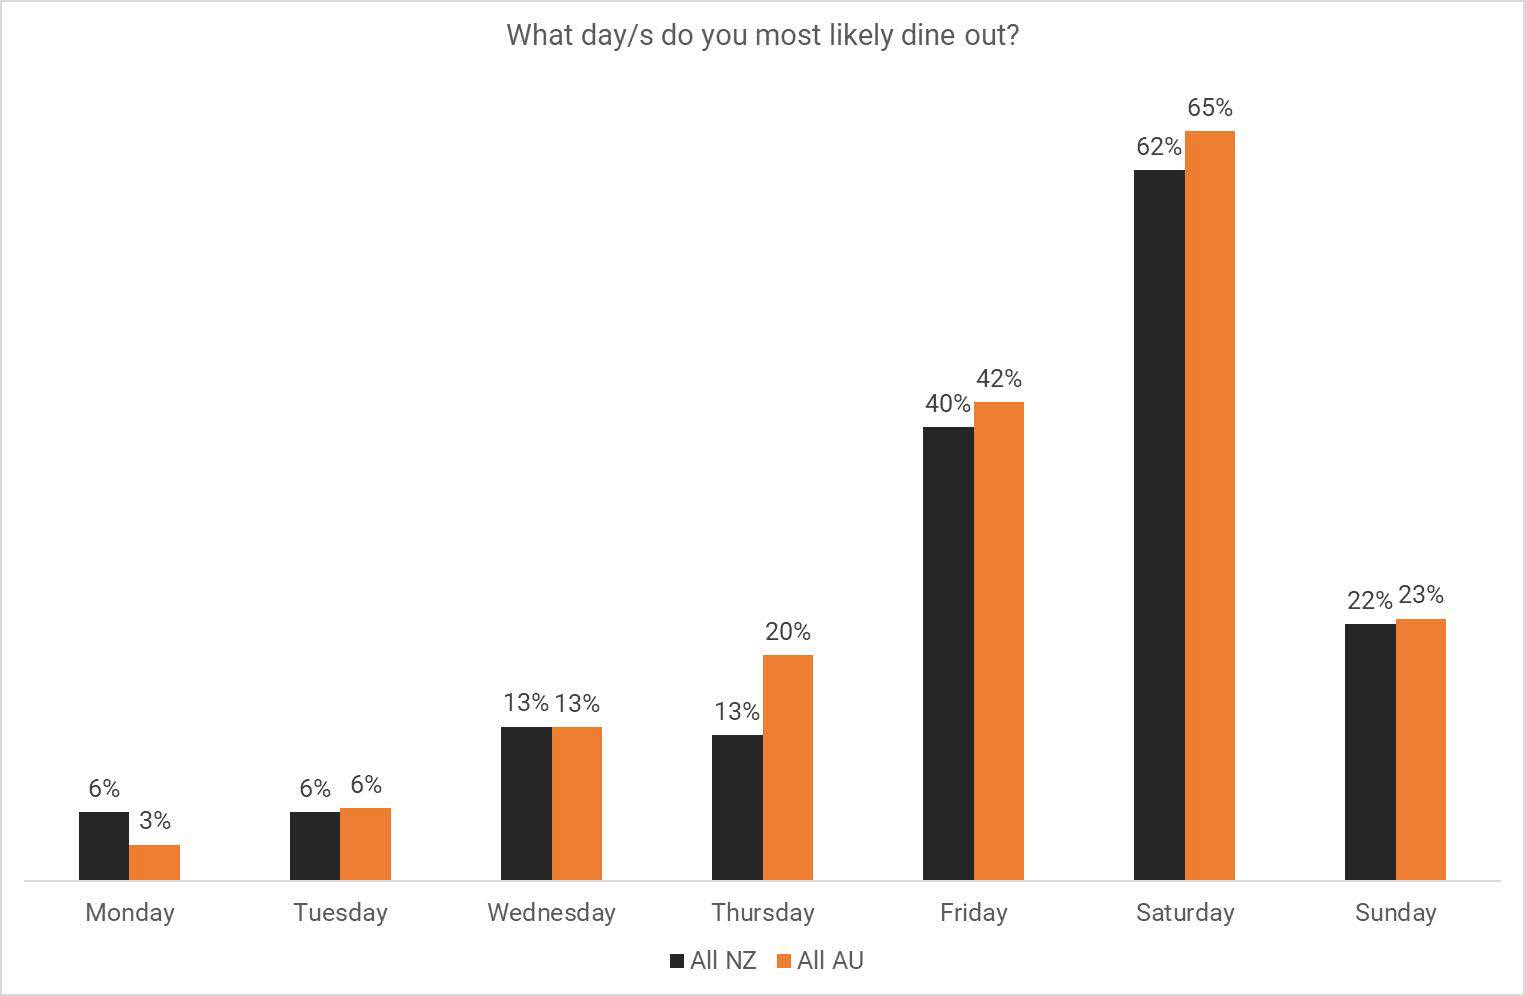
When it comes to what days of the week are most popular for Australians to eat out, the trend leans towards Fridays and Saturdays. Most likely due to the lack of work the next day, a poll on what days they are most likely to eat out revealed that 42% of Australians said Friday, while 65% said Saturday. Monday remains the lowest, with only 3% saying they are likely to head out to any hospitality businesses during that day.
The Australian Bureau of Statistics provided an insight into state and territory spending during 2022, including the rise in how much each household spent on hotels, cafes and restaurants from the previous year.
NSW: Spending rose by 28.5%
VIC: Spending rose by 21.1%
QLD: Spending rose by 24.1%
SA: Spending rose by 20.9%
WA: Spending rose by 11.3%
Tas: Spending rose by 12.4%
NT: Spending rose by 39.1%
ACT: Spending rose by 9%
Diner behaviour at its core retains a desire for manners and efficient communication from both parties involved. However, plenty of changes have occurred to Australian dining behaviours since the beginning of the pandemic, which has become obvious as businesses open up once more in 2022.
The years of lockdowns and closed businesses have made many Australians used to their habits of eating at home, whether it is through food delivery or meal preparation. In 2022, this culminated in the online food delivery platforms reaching their peak market worth of $851 million, an estimated 1.7% growth from 2021.
However, many are tired of this trend of eating at home. With restrictions easing at the start of 2022, many Australians set out to celebrate all the events they missed during the pandemic by dining at restaurants, cafes and bars once more.
Back in 2020, only 8% of Australians said they would not return to restaurants once the industry opened up once more, citing worries about health and safety. While this did not deter Australians from returning to dining out, it did affect their overall concerns. In fact, the key factors driving customers' diner behaviour during and after the pandemic can be summarised into three main points:
the dining environment;
the level of cleanliness, and;
communication between employees and customers
So long as these requirements are upheld, most Australians are happy to continue eating out at their favourite businesses.
If you are looking for ways that your business can contribute more, not only to the Australian economy, but to your own success, book a personalised demo of what ResDiary can do for your business today.
The hospitality industry employed 849,500 Australians during 2021, which is a significantly higher amount of employment when compared to Administrative and Support Services (448,300), or even Information Media and Telecommunications (192,500).
Prior to the pandemic, hospitality services was showing a steady increase in job opportunities and revenue alike. With 2021 showing significant improvement in these statistics over 2020, it is almost certain that the hospitality industry will continue to grow.
The hospitality industry not only contributes a sizeable force of ready employment to Australians, but it also generates income into the Australian economy.
This can be seen in an observation of the domestic consumption of coffee during 2022, as Australia is known for its impressive coffee culture. During the year, domestic coffee consumption reached over 2.1 million 60-kilogram bags, an increase from 1.96 million in 2020. Furthermore, just by looking at the yearly revenue of $8.6 billion within the coffee market provides an insight of just how much one aspect of the hospitality industry can contribute to the economy.
Additionally, tourism and hospitality are intrinsically linked, with an average of 30 cents of every international tourist dollar going towards accommodation and food services in Australia. So not only does the industry provide domestic contribution to the economy, but also internationally.


.jpg)